
AltGosling

Automatic Generation of Text Descriptions for Accessible Genomics Data Visualization
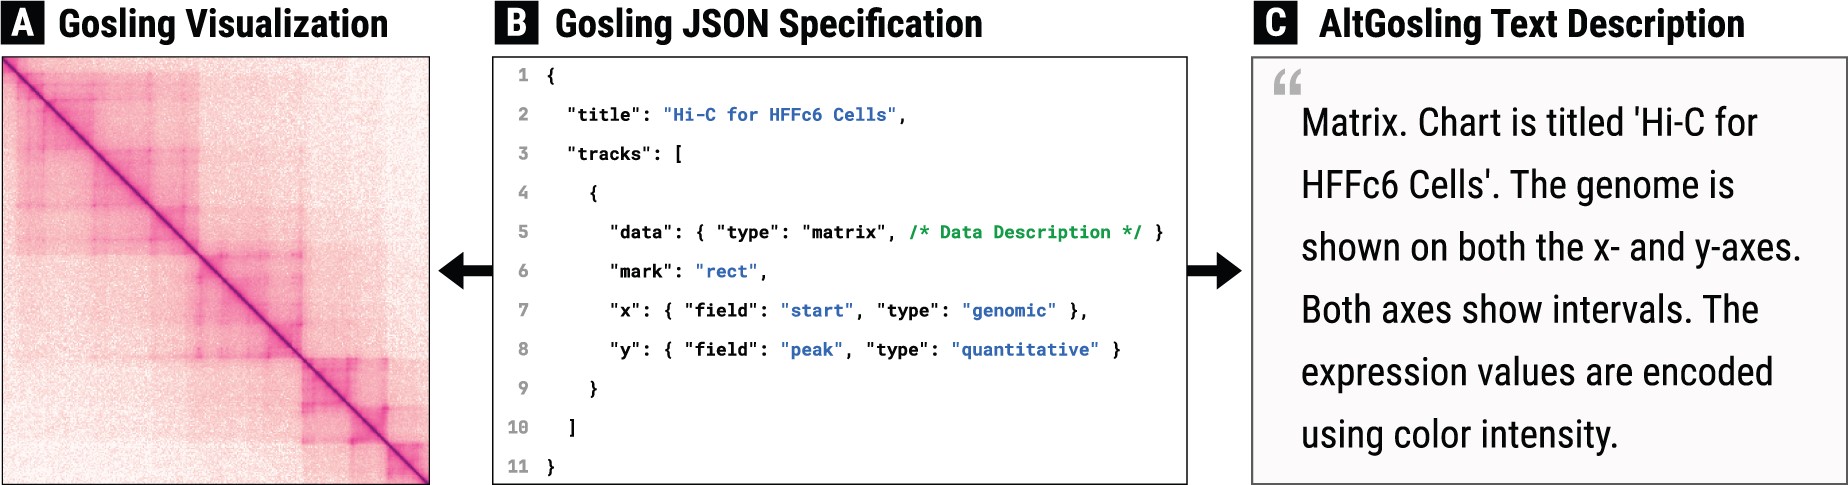
Schematic with three boxes. The middle box has arrows to the left and right box. The left box (A), titled ‘Gosling Visualization,’ shows a heatmap matrix. The middle box (B), titled ‘Gosling JSON Specification,’ shows text in JSON format. The right box (C), titled ‘AltGosling Text Description,’ shows text in a quotation mark. The text in the right box reads ‘Matrix. Chart is titled ‘Hi-C for HFFc6 Cells’. The Genome is shown on both the x- and y-axes. Both axes show intervals. The height of the expression values is shown with colors.

Grammar-Based

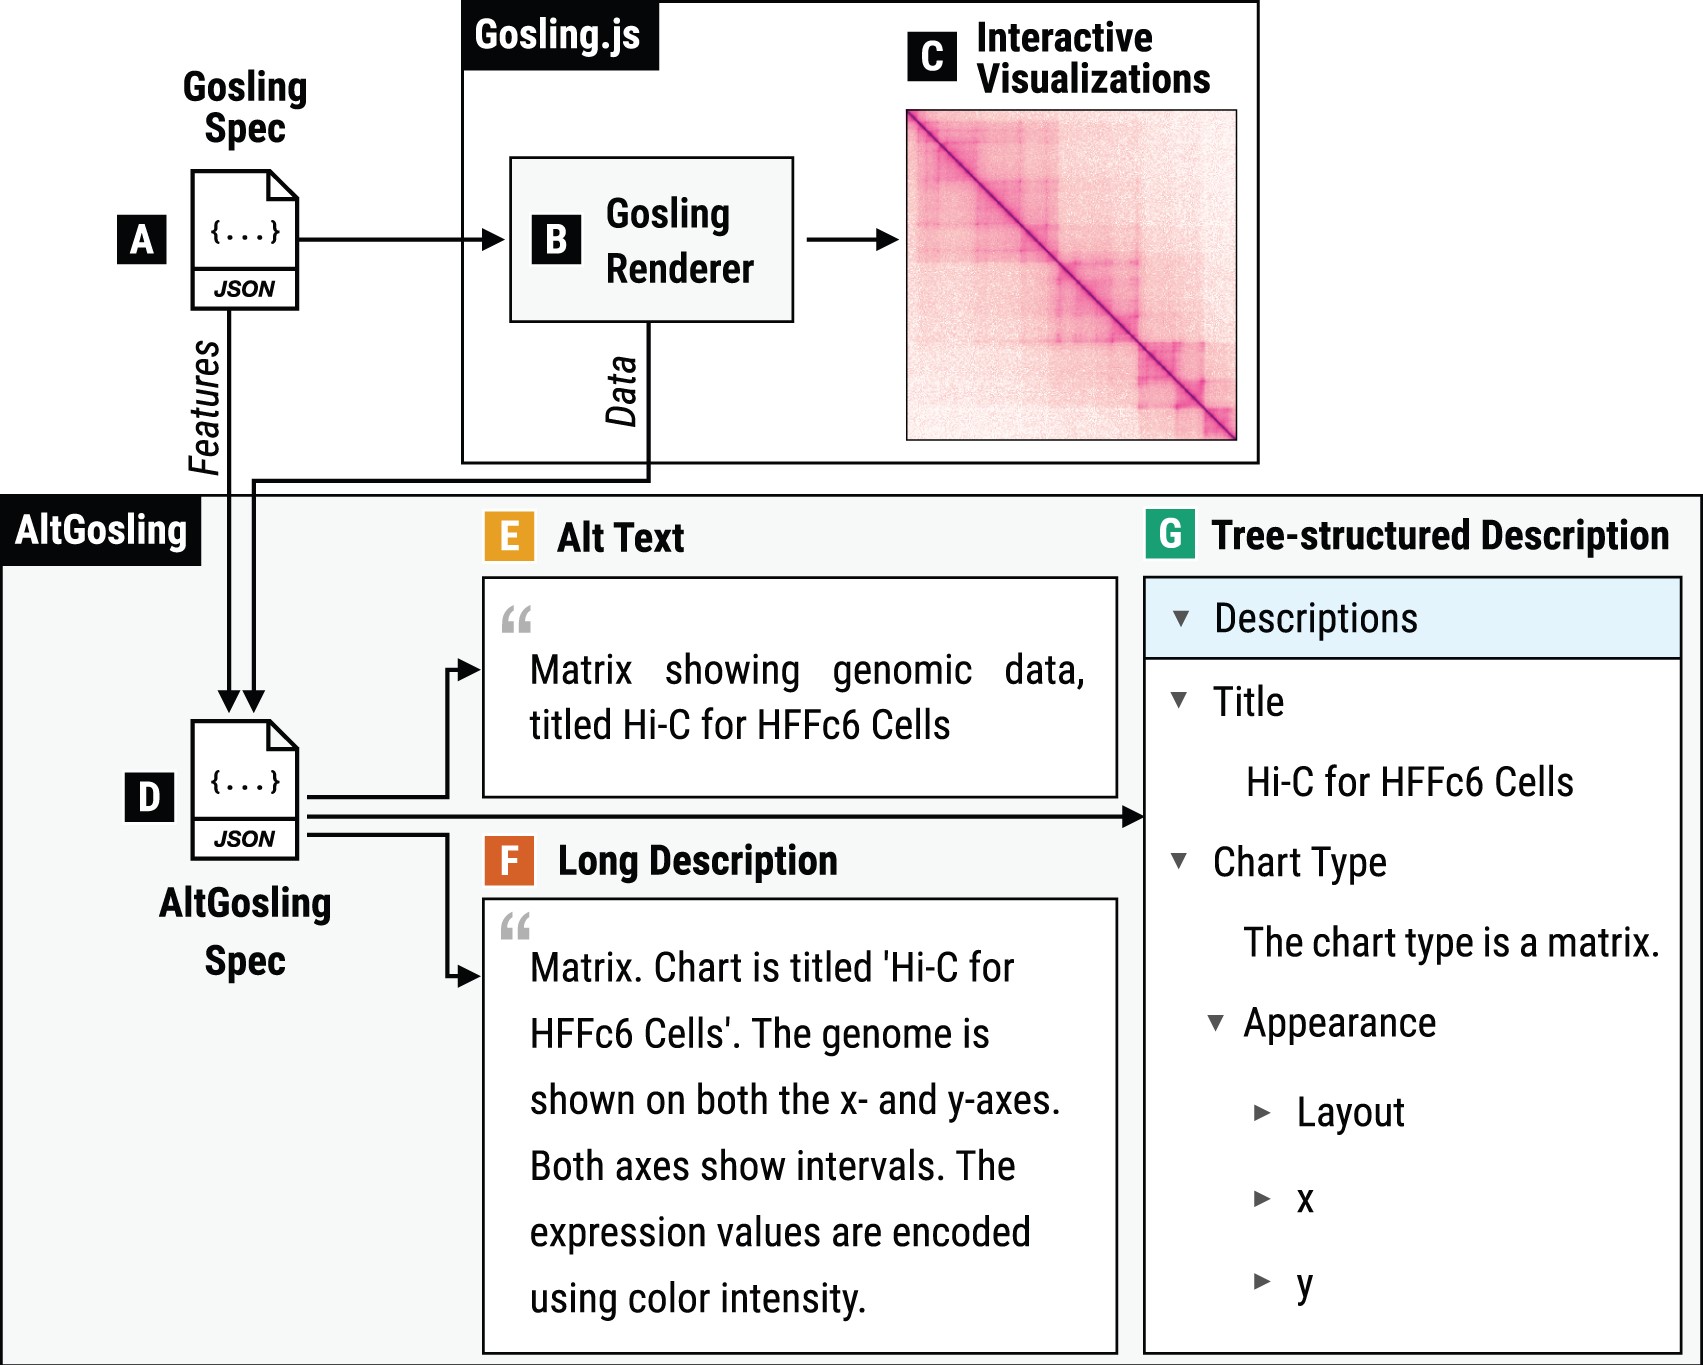
Based on flexible grammar-based genomics toolkit Gosling

Schematic with two sections. On the top left is a file icon with ‘Gosling Spec’. This points to the right section, labeled ‘Gosling.js,’ and the bottom section, labeled ‘AltGosling’.

Flexible

Various options for text descriptions
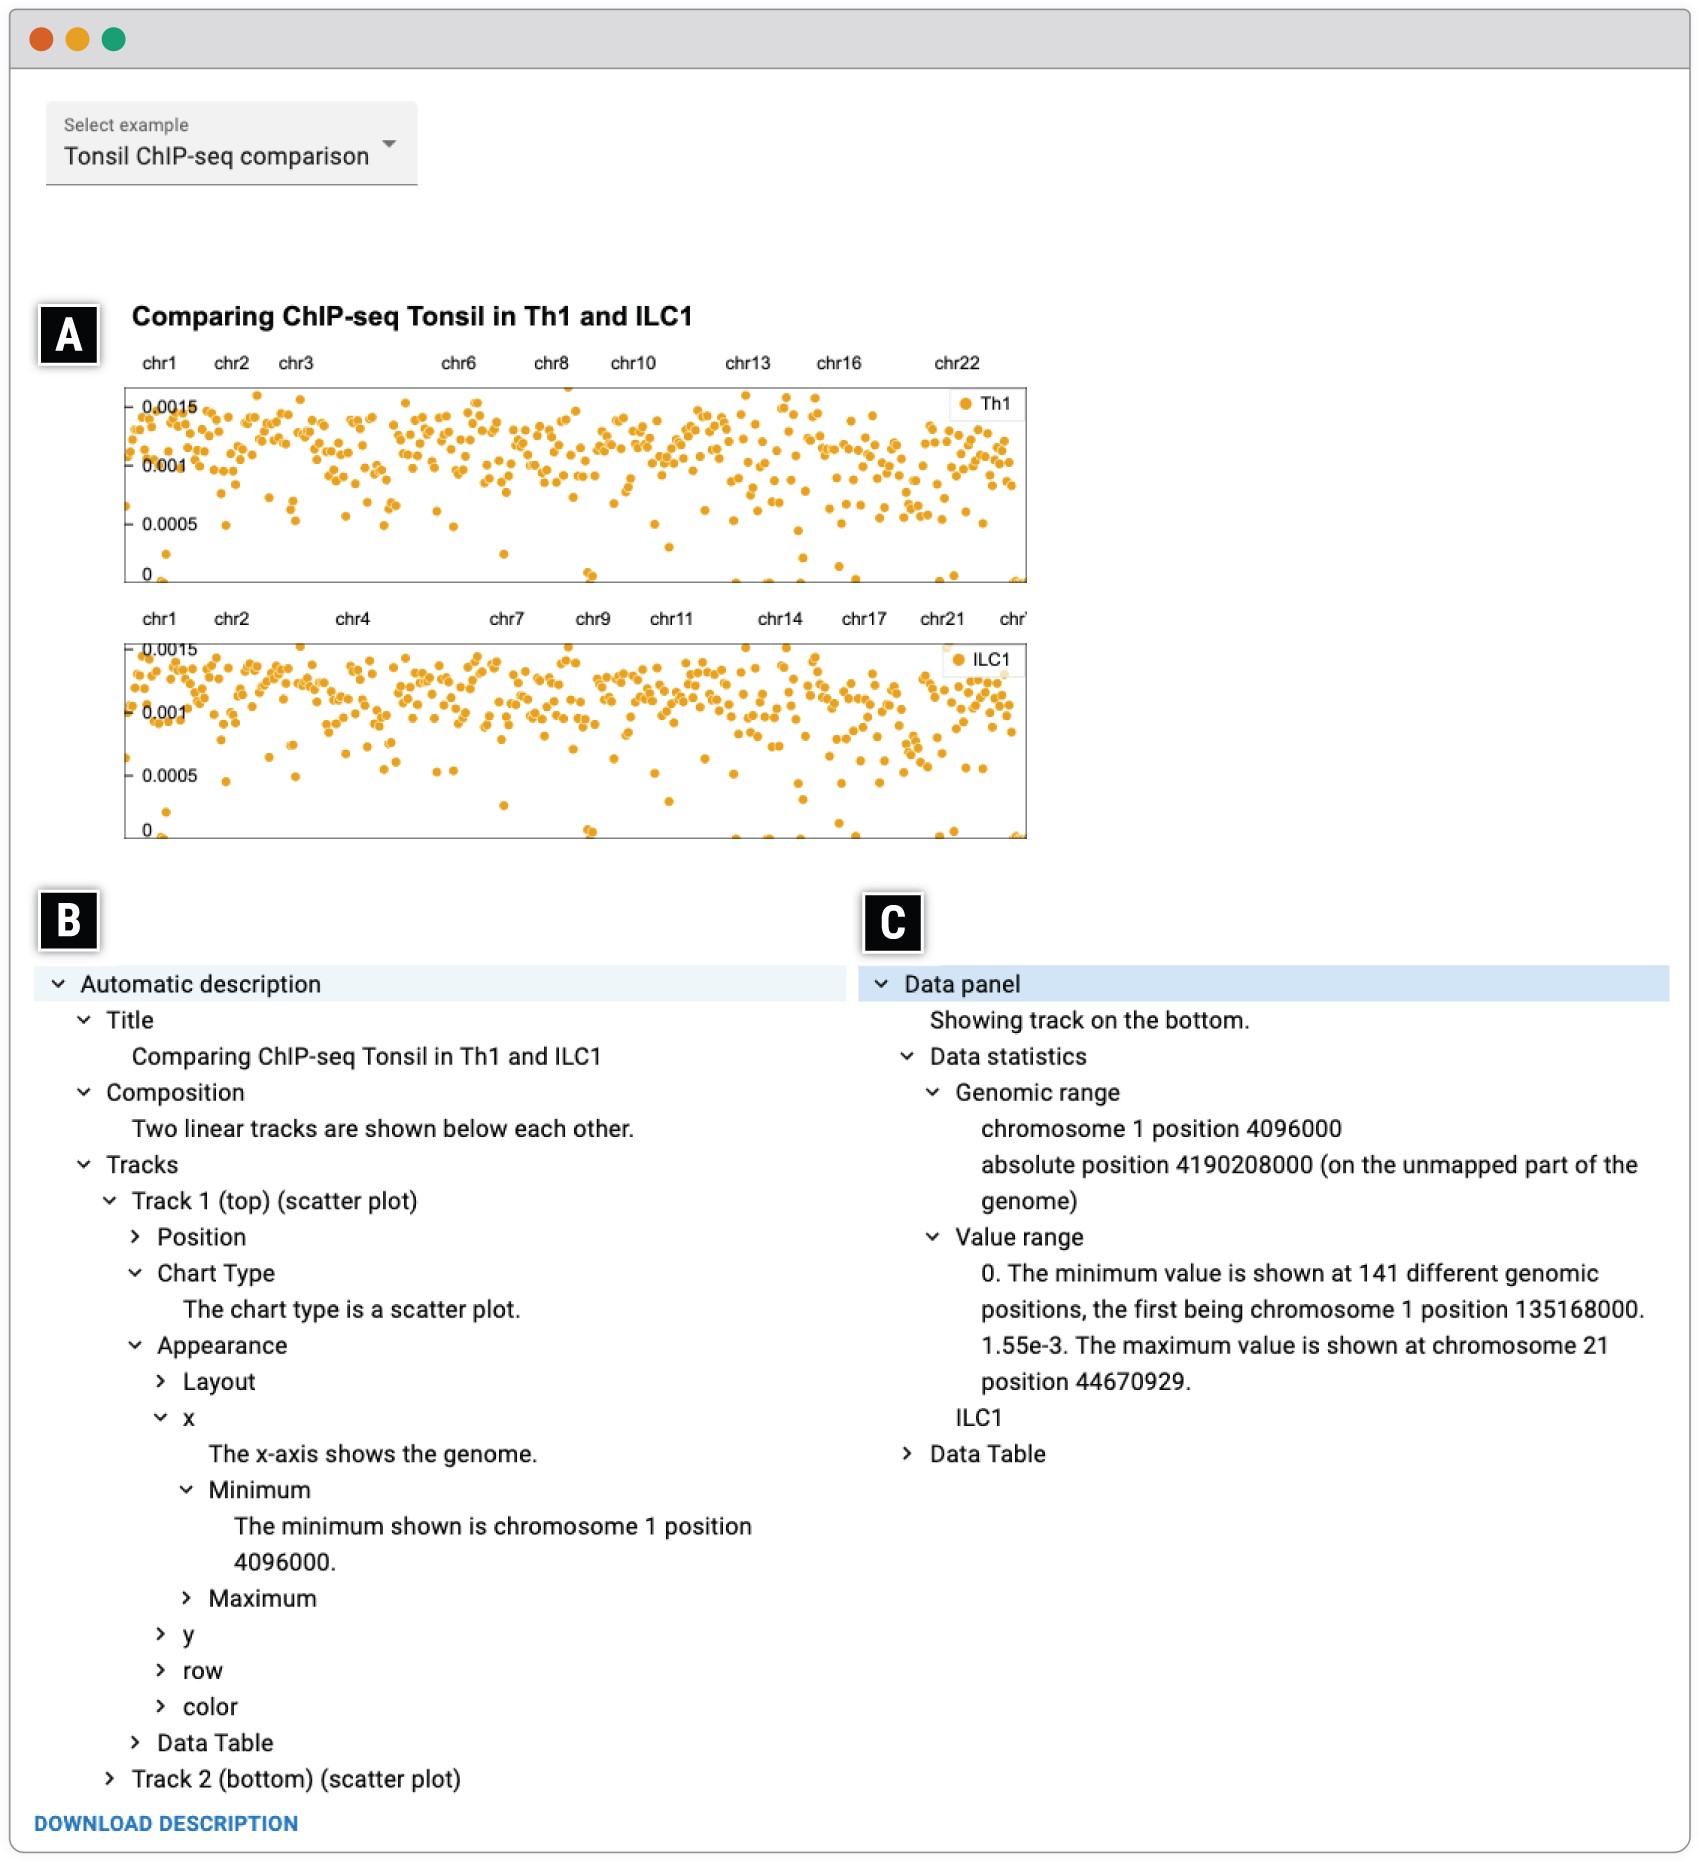
Screenshot of AltGosling in browser. On top is a Gosling visualization with two scatter plots. Below are two partially expanded panels, showing information such as title, tracks, appearance, and data table.

Navigable

Deliver descriptions in easy navigable format